[그래프 그리는 사이트] Mosaic plot from summary data
site : https://tinyurl.com/table2Mosaic
The data is organized in tabular form. This table shows the number of supporters by region for each political party in a country.
데이터는 표의 형태로 정리되어 있습니다. 이 표는 한 나라의 각 정당별 지역별 지지자 숫자를 보여 줍니다.
Shows a mosaic plot with an area proportional to the number of supporters.
지지자들의 숫자에 비례하는 면적을 가진 모자이크 plot을 보여줍니다.
You can change the color and change the axis format to get a better looking shape.
색을 바꾸어 주고, 축 서식을 바꾸어 주어 조금 더 보기 좋은 형태를 얻을 수 있습니다.
다른 옵션들도 직접 실행해 보시기를 추천합니다.
You can look at various plots with similar functions.
비슷한 기능을 가진 다양한 plot들을 살펴볼 수 있습니다.
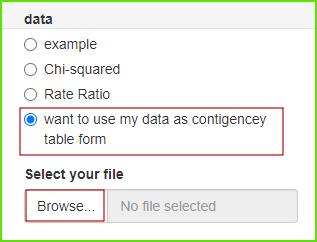
당신의 데이터를 업로드 하려면 'my data'를 선택하고, 'Browse'를 클릭하세요.
오직 csv 파일만이 사용가능합니다.
Select 'my data'' to upload your data, then click 'Browse'.
Only csv file is available.
'plot download'를 통해서 plot size를 조절하세요.
< PDF >, < SVG > < pptx >를 클릭하면 각각의 형식으로 다운로드 받을 수 있습니다.
Adjust the plot size through 'plot download'.
You can download each format by clicking < PDF >, < SVG > < pptx >.


댓글 없음:
댓글 쓰기