[그래프 그리는 사이트] Plot with error bar (II) & forest plot
https://tinyurl.com/Plot-error-bar-II
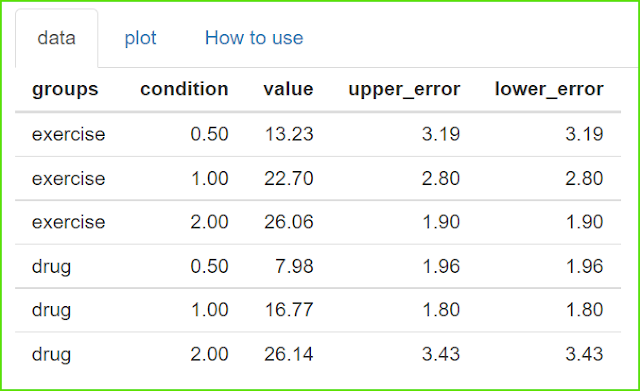
As you can see in the example data, 5 fixed column names are mandatory.
예제 데이터에서 보는 것과 같이 5개의 정해진 열이름이 필수적입니다.
꺽은선 차트에 오차막대가 있는 전형적인 형태입니다.
당신이 'select plot'에서 'line' 대신에 'bar'를 선택한다면,
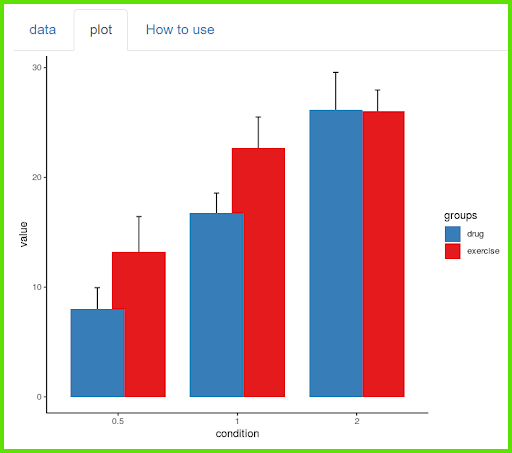
If you select 'dynamite' instead of 'line' in 'select plot',
당신이 'select plot'에서 'line' 대신에 'bar'를 선택한다면,
You'll get another common form, bars and error bars.
또 다른 흔한 형태인, 막대와 오차막대를 얻게 될 것입니다.
또 다른 흔한 형태인, 막대와 오차막대를 얻게 될 것입니다.
The rest of the areas are all decorative options.
If you try it yourself, you can intuitively get great results.
나머지 영역은 모두 꾸미기 위한 옵션들입니다.
여러분이 직접 시행해 보면 직관적으로 훌륭한 결과를 얻을 수 있습니다.
위의 것들은 다양한 결과물의 일부입니다.
Note that in line charts, the values on the x-axis are arranged in proportion to the number, and in bar charts, they are arranged at equal intervals.
선차트는 엑스축의 값이 숫자에 비례해서 배치되고, 막대차트는 등간격으로 배치된다는 것을 주의하세요.
If you flip the line after subtracting the line from the line chart and leaving only the error bar, it becomes a forest plot.
선차트에서 선을 빼고 오차막대만 남긴 뒤에 flip하게 되면 forest plot이 됩니다.
위에 보이는 3개의 옵션을 따라하면 쉽게 forest plot을 만들 수 있습니다.
Activate 'want to use' to upload your data, then click 'Browse'.
Only csv file is available.


댓글 없음:
댓글 쓰기