[그래프 그리는 사이트] Scatter plot and 2D densitogram
예제 데이터 중에서 2개의 숫자 열을 택해서 산점도를 만들어 보겠습니다.
Column 3 will be on the x-axis and column 5 will be on the y-axis.
Column 2 is arranged in groups and displayed in color.
'which densitogram?'을 1로 선택하면 당신은 이 plot을 얻게 됩니다.
당신은 위의 그림처럼 설정하면 됩니다.
각 점의 크기를 달리하고 싶다면,
색깔에 따라(그룹에 따라) 완전히 분리하여 산점도를 그리려고 한다면
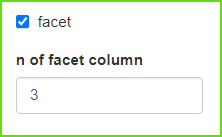
After enabling 'facet', we determine 'n of facet column'.
If it is set to 3, as shown above, 3 plots are arranged horizontally.
'facet'을 활성화시킨다음에 'n of facet column'을 결정합니다.
3으로 하게 되면 위에서 보여지듯이 가로로 3개의 plot이 배열됩니다.
3으로 하게 되면 위에서 보여지듯이 가로로 3개의 plot이 배열됩니다.
만들어진 plot을 꾸밀 수 있는 많은 옵션들이 있습니다.
여러분 스스로 직접 해 보면서 익히는 것을 권장합니다.
There are many options to decorate the created plot.
We recommend that you learn by doing it yourself.
'plot download'를 통해서 plot size를 조절하세요.
< PDF >, < SVG > < pptx >를 클릭하면 각각의 형식으로 다운로드 받을 수 있습니다.
Adjust the plot size through 'plot download'.
You can download each format by clicking < PDF >, < SVG > < pptx >.
당신의 데이터를 업로드 하려면 'want to use my data'를 활성화한 다음, 'Browse'를 클릭하세요.
오직 csv 파일만이 사용가능합니다.
Activate 'want to use my data' to upload your data, then click 'Browse'.
Only csv file is available.


댓글 없음:
댓글 쓰기