[그래프 그리는 사이트] R 데이터 시각화 4권

----------- ----------- ----------- ----------- ----------- ----------- -----------

2-1. Dendro Bubble Plot https://tinyurl.com/Dendro-Bubble

2-2. Circular Chord diagram https://tinyurl.com/Chord-Plot

2-3. Sankey Wheel https://tinyurl.com/sankeywheel

2-4. Sankey Flow https://tinyurl.com/Sankey-Flow

2-5. D) Alluvial Diagrams https://tinyurl.com/D-Alluvial

2-6. Level Flow Chart https://tinyurl.com/level-flow2

2-7. Corset Plot https://tinyurl.com/Corset-Plot

2-8. Quadrant Scatter Plot https://tinyurl.com/quadscatter

2-9. Quiver(vector) Plots https://tinyurl.com/Quiver-Plots

2-10. Czekanowski’s Diagram https://tinyurl.com/Czekanowski-Diagram

2-11. Funnel Plot for Proportion

2-12. Color Table
https://tinyurl.com/Color-Table

2-13. Multi Regression Fit
https://tinyurl.com/MultiRegression

2-14. Q-Q Boxplot

2-15. Pearson correlation with CI https://tinyurl.com/correlation-CI

2-16. Common Structures of Bias https://tinyurl.com/BiasStructures

2-17. Pair Plot https://tinyurl.com/PairPlot

2-18. Epidemiological Contacts https://tinyurl.com/Epi-Contact

2-19. R Pivot Table & Plot https://tinyurl.com/R-Pivot-table

2-20. Combination Count Plot(II) https://tinyurl.com/Combi-Plot2

2-21. Venn Diagram(IV) https://tinyurl.com/VennD4

2-22. Venn Diagram(III) https://tinyurl.com/VennDiagram3

2-23. Bipartite Network Plot https://tinyurl.com/bi2-network

2-24. Life Zones Triangle https://tinyurl.com/LifeZoneT

2-25. Isotonic Regression https://tinyurl.com/isotonicR

2-26. Grouped Box Plot https://tinyurl.com/grouped-Box

2-27. Bag Plot https://tinyurl.com/Bag-Plot

2-28. Elliplot https://tinyurl.com/Elliplot

2-29. Conditioning Plot(II) https://tinyurl.com/Conditioning-Plot-II

2-30. Multiple Duoplot https://tinyurl.com/duoplot

2-31. Letter Plot https://tinyurl.com/Letter-Plot

2-32. Stem Leaves https://tinyurl.com/Stem-Leaves

2-33. Inequality and Poverty https://tinyurl.com/Inequality-Poverty

2-34. Grouped Stack Barplot https://tinyurl.com/Barplots

2-35. Linear/Nonlinear Regression https://tinyurl.com/4Regression

2-36. Confusion Matrix Plot https://tinyurl.com/Matrix-Plot

2-37. 2D Density Plot https://tinyurl.com/2D-Density

2-38. QR code generator https://tinyurl.com/editQR

PART 3. 시간과 관련차트

3-1. Repeated Means Plot https://tinyurl.com/Re-Means

3-2. Many Repeated Means Plot https://tinyurl.com/Re-M4many

3-3. Summary Plot https://tinyurl.com/SummaryPlot

3-4. Aggregate Plot https://tinyurl.com/Aggregate-Plot

3-5. Horizon Plot(III) https://tinyurl.com/HorizonPlots3

3-6. Peak Valley Plot(Radiation) https://tinyurl.com/PeakVall

3-7. Max Point line plot https://tinyurl.com/Point-line

3-8. Detecting Anomalies in Data https://tinyurl.com/Anomalies-Data

3-9. Recurrence Plot https://tinyurl.com/Plot4Recur

3-10. Swimmer Plot https://tinyurl.com/Swimplot

3-11. Multiple Change Points https://tinyurl.com/Change-Points

3-12. Finding Inflection Points https://tinyurl.com/inflection-p

3-13. Inflection from GAM fit https://tinyurl.com/GAM-inflection

3-14. Climate Graph https://tinyurl.com/Climate-Graph

.
3-15. Plots for Time & State https://tinyurl.com/time-state

3-16. Surveillance Graph https://tinyurl.com/SurveilPLOT

3-17. Monthly & Yearly Calendars https://tinyurl.com/MY-Calendars

3-18. Calendars and Gannt Chart https://tinyurl.com/Cal4Gant

3-19. D) Timeline https://tinyurl.com/D-Timeline-I

3-20. Gantt Chart https://tinyurl.com/Gantt-C

3-21. Event Chart https://tinyurl.com/Event-Chart

3-22. Cosinor Regression Model https://tinyurl.com/Cosinor-Reg

3-23. Chronological Plot https://tinyurl.com/Chronplot

3-24. Bump Chart(II) https://tinyurl.com/BumpChart2

3-25. Multiple Run Charts https://tinyurl.com/MultiRun

3-26. SPC charts for NHS https://tinyurl.com/SPC4NHS

3-27. Body Weight with ID https://tinyurl.com/IDWeight

3-28. Stream Plot(III) https://tinyurl.com/stream-plot3

3-29. Comparative Line Plot https://tinyurl.com/Comparative-Line-Plot

3-30. Google Trends https://tinyurl.com/Goo-Trend
3-31. Forecast Murphy Diagrams https://tinyurl.com/Murphy-D
 .
.
3-32. Lexis diagram(2) https://tinyurl.com/Lexis-D2

3-33. Trajectory Clustering https://tinyurl.com/traject-cluster

PART 4. 지도

4-1. Flights Plots https://tinyurl.com/flightsPlots

4-2. D) OECD Bar https://tinyurl.com/D-OECD-bar

4-3. D) EU Bar https://tinyurl.com/D-EU-bar2

4-4. D) Japan Bar https://tinyurl.com/D-Japan-bar

4-5. D) South East Asian Bar https://tinyurl.com/D-SEA-bar

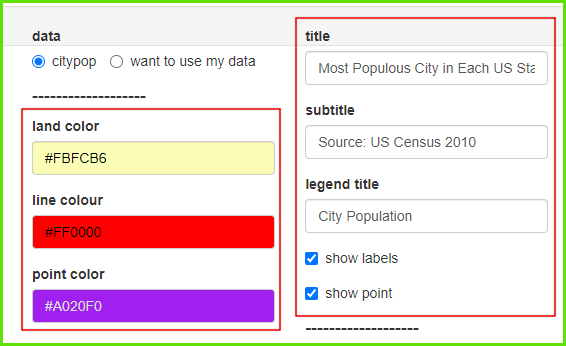
4-6. D) USA Bar https://tinyurl.com/D-USA-bar

https://tinyurl.com/https://tinyurl.com/D-USA-DC
https://tinyurl.com/D-USA-census

4-7. D) Korea-sido Bar Chart https://tinyurl.com/D-Korea-bar

4-8. D) Seoul Bar Chart https://tinyurl.com/D-Seoul-bar

4-9. D) Seoul Line Chart https://tinyurl.com/D-Seoul-line

4-10. Quiver Wind Plot https://tinyurl.com/Quiver-Wind

PART 5. 유전과 인간5

5-1. Haplotypes in a cell https://tinyurl.com/Haplotypes

5-2. Nucleobase Plot https://tinyurl.com/Nucleobase-Plot

5-3. Lollipop for Mutation https://tinyurl.com/lollipop-mutation

5-4. Population Genetics https://tinyurl.com/Pop-Gene

5-5. D) Pedigree Chart https://tinyurl.com/D-Pedigree

5-6. D) Pyramid Chart https://tinyurl.com/D-Pyramid

5-7. D) Dual Pyramid Chart https://tinyurl.com/D-Dual-Pyramid

5-8. D) Compare Populations https://tinyurl.com/D-Compare-Pop

5-9. MA plot https://tinyurl.com/ma4RNA

5-10. Gene Ontology Bubble Plot https://tinyurl.com/Ontology-Bubble

5-11. GO(gene ontology) Plot https://tinyurl.com/Goplot

5-12. Sequence Logo Plot https://tinyurl.com/Seq-Logo

5-13. Sequence Letter Plot https://tinyurl.com/Seq-Letter

5-14. Medical Illuster https://tinyurl.com/Human-ana

5-15. Blood Pressure Study https://tinyurl.com/B-Press

5-16. Growth Charts https://tinyurl.com/Chart4Growth

5-17. Growth Curves https://tinyurl.com/Growth-Curve

5-18. Cancer Adverse Events https://tinyurl.com/Cancer-AE

5-19. Brain Atlas https://tinyurl.com/Brain-Atlas

5-20. Visual Fields https://tinyurl.com/visualFields

5-21. Daily Physical Activity https://tinyurl.com/Daily-Behavior

PART 6. 통계와 차트

6-1. Confidence Interval https://tinyurl.com/Cisimul

6-2. Think-More Plot https://tinyurl.com/think-more

6-3. Compare Two Correlations https://tinyurl.com/Compare2corr

6-4. PS Matching(III) https://tinyurl.com/PS-Matching3

6-5. Many ROC https://tinyurl.com/many-ROC

6-6. Benford Test https://tinyurl.com/D-Benford

6-7. Sliding Chart https://tinyurl.com/Slidingchart

6-8. Repeated Correlation https://tinyurl.com/Repeated-Correlation

6-9. Survival ROC https://tinyurl.com/survivalROC

6-10. Find Missing https://tinyurl.com/missing-treat

6-11. Missing Data https://tinyurl.com/4Missing

6-12. Box Cox Transformation(II) https://tinyurl.com/Box-Coxes

6-13. Standardization https://tinyurl.com/easy-Standard

6-14. Fagan’s Nomogram https://tinyurl.com/Fagan-nomogram

6-15. Agreement and Reliability https://tinyurl.com/SimplyAgree

6-16. Linear Mixed Effects Model https://tinyurl.com/LMM-long

6-17. Hierarchical cluster analysis https://tinyurl.com/Item-Cluster

6-18. Supervised Heatmap https://tinyurl.com/Supervised-Heatmap

6-19. Single-Case Data Analyses https://tinyurl.com/Single-Case

6-20. Single-Case Random Test https://tinyurl.com/SingCRT

6-21. Relative survival https://tinyurl.com/Rel-surv

6-22. Correlation Funnel Plot https://tinyurl.com/Correlation-Funnel

6-23. Explore Plot https://tinyurl.com/plot4explore

6-24. Tools for regression models https://tinyurl.com/T4regression

6-25. Linearity Check Plots https://tinyurl.com/linearity-plot

6-26. Subgroups Forest Plot(I) https://tinyurl.com/Forest4Subgroups

6-27. Subgroup Forest Plot(II) https://tinyurl.com/Subgroup-S

6-28. Regression Discontinuity https://tinyurl.com/R-Discontinuity

6-29. False Discovery Rate Plot https://tinyurl.com/Plot4FDR

6-30. Bias Precision Plot https://tinyurl.com/Bias-Precision

6-31. Bioequivalence Study https://tinyurl.com/Bio-Equ2

6-32. CONSORT Diagram(I) https://tinyurl.com/ConsortDiagram

6-33. CONSORT Diagram(II) https://tinyurl.com/CONSORT-D

6-34. Flow Diagram https://tinyurl.com/Flow-D

6-35. Time-dependent ROC curve https://tinyurl.com/Time-ROC

6-36. Association Analysis https://tinyurl.com/Asso-Anal

6-37. Plateau Chart https://tinyurl.com/Plateau-Chart

6-38. FF Decision Tree https://tinyurl.com/FF-Dtree

6-39. PRECIS-2 & Radar Charts https://tinyurl.com/2PRECIS

6-40. 3D Volcano Plot https://tinyurl.com/Polar4Three

6-41. Adherence Plot https://tinyurl.com/AdherenceMed

6-42. Mean and SD from Quantiles https://tinyurl.com/estmeansd

6-43. 잘려진 정규분포 https://tinyurl.com/Detect-Nonnormal

>> 중심극한정리 실험
https://tinyurl.com/Central-Limit
part 7 발표용 plot

7-1. D) Rose Plots https://tinyurl.com/D-Rose-Plots

7-2. D) Dynamic line chart https://tinyurl.com/D-Dynamic-line

7-3. D) Infectious Dynamics https://tinyurl.com/D-Infect-Dyn

7-4. D) Matrix Bubble Plot https://tinyurl.com/D-Matrix-Bubble

7-5. D) Pareto Plot https://tinyurl.com/D-Pareto-C

7-6. D) ANOVA & Kruskal-Wallis https://tinyurl.com/D-Kruskal-Wallis

7-7. D) Bars and Lollipops https://tinyurl.com/D-LollipopBars

7-8. D) Understand ROC https://tinyurl.com/D-Understand-ROC

7-9. D) Wordcloud(I) https://tinyurl.com/D-Wordcloud

7-10. D) Wordcloud(II) https://tinyurl.com/D-wordcloud2

7-11. D) Compare Events main https://tinyurl.com/D-EventsRisk

7-12. D) SixSigma Capability https://tinyurl.com/D-6S-Capability

7-13. D) SixSigma Process Map https://tinyurl.com/D-6S-Process

7-14. D) Quality Improvement https://tinyurl.com/D-Qual-I

7-15. D) Quality Control Charts https://tinyurl.com/D-Qual-C

7-16. D) CUSUM-EWMA Chart https://tinyurl.com/D-CUSUM-EWMA

7-17. D) Quality Loss Function https://tinyurl.com/D-Qual-Loss

7-18. D) Correlogram https://tinyurl.com/D-Correlogram

7-19. D) Likert Chart(I) https://tinyurl.com/D-Likert-1

7-20. D) Matrix Correlations https://tinyurl.com/D-Mat-Corr

7-21. D) Cause Effect Diagram https://tinyurl.com/D-fish-CE