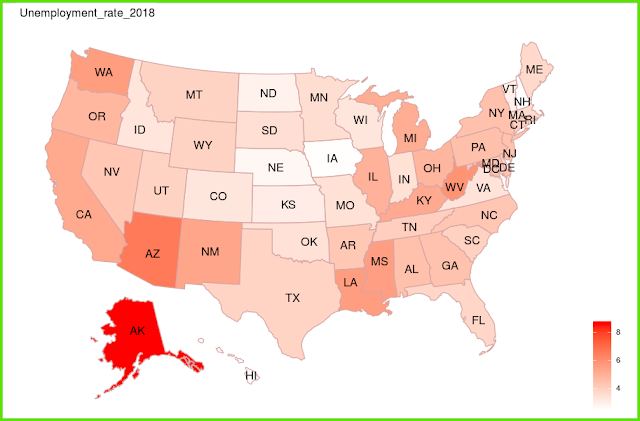
[그래프 그리는 사이트] US Map
A simple and useful tool to map the results of US states and counties.
미국의 주와 county의 결과들을 지도로 표현할 수 있는 간단하고 유용한 도구입니다.
1열은 미국의 주의 이름이며 2열부터 4열까지 숫자로 된 데이터가 있습니다.
각 주별로 숫자를 색의 진하기로 표현해 줍니다.
Now let's change 'data' from 'state' to 'county'.
There is data organized by each county.
이제는 'data'를 'state'에서 'county'로 바꾸어 봅시다.
각 county 별로 정리된 data가 있습니다.
몇 가지 색을 바꾸어 주는 옵션들을 활용할 수 있습니다.
'plot download'를 통해서 plot size를 조절하세요.
< PDF >, < SVG > < pptx >를 클릭하면 각각의 형식으로 다운로드 받을 수 있습니다.
Adjust the plot size through 'plot download'.
You can download each format by clicking < PDF >, < SVG > < pptx >.
당신의 데이터를 업로드 하려면 'want to use'를 활성화한 다음, 'Browse'를 클릭하세요.
오직 csv 파일만이 사용가능합니다.
Activate 'want to use' to upload your data, then click 'Browse'.
Only csv file is available.


댓글 없음:
댓글 쓰기