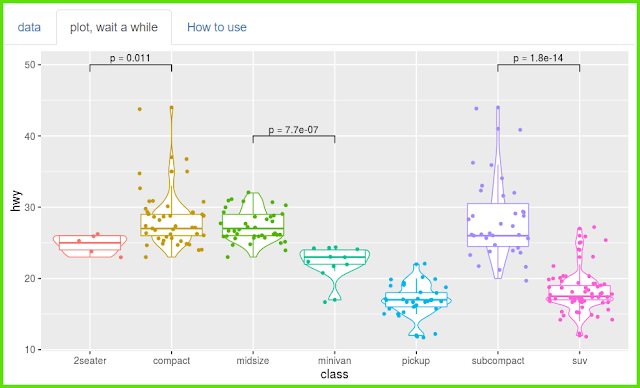
[그래프 그리는 사이트]Plot with Significance(p-values)
예제 데이터의 1열은 집단변수이며, 2열은 숫자 변수 입니다.
and the p-value is expressed by pairing two groups at the same time.
여러 집단의 측정값들이 그래프에 표현되어 있고
동시에 두 집단씩 짝을 지어 p값을 표현해 줍니다.
This option specifies where the three p-values are located.
Groups 1-2, 3-4, and 6-7 are compared.
Each location is also specified.
3개의 p값이 어떤 위치에 있을지 지정해 주는 옵션입니다.
1-2집단, 3-4집단, 6-7집단이 비교됩니다.
각각의 위치도 지정됩니다.
For statistical tests, t-test, which is a parametric test,
and its non-parametric test (wilcox.test) are performed.
You can draw violin plots, boxplots and jitter plots,
and you can draw each in black and white and color.
통계적 test는 모수검정인 t-test와 이것의 비모수 test(wilcox.test)를 시행해 줍니다.
violin plot와 boxplot와 jitter plot를 그릴 수 있으며 각각을 흑백과 color로 그릴 수 있습니다.
'plot download'를 통해서 plot size를 조절하세요.
< PDF >, < SVG > < pptx >를 클릭하면 각각의 형식으로 다운로드 받을 수 있습니다.
Adjust the plot size through 'plot download'.
You can download each format by clicking < PDF >, < SVG > < pptx >.


댓글 없음:
댓글 쓰기