[그래프 그리는 사이트] Parallel Coordinate Plot(III)


Up to column 4 are numeric variables, and column 5 is data with nominal variables.
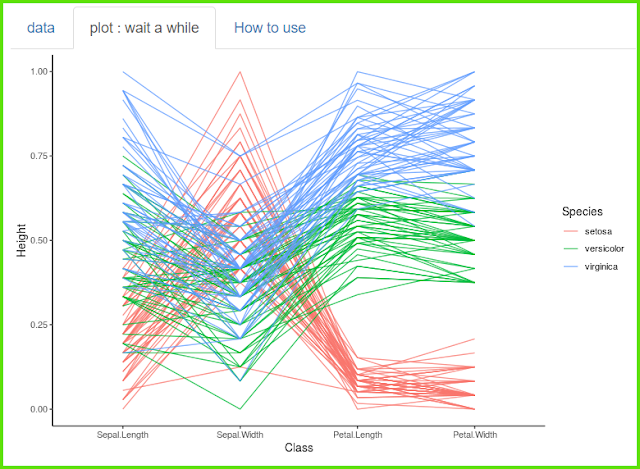
4열까지는 숫자 변수이며, 5열은 명목변수인 데이터입니다.

It shows how each number varies depending on the group.
집단에 따라서 각 숫자들이 어떻게 달라지는지 보여 줍니다.
One row is data obtained from one person, and one person's data is a straight line.
하나의 행은 한 사람에게세 얻어진 데이터이며, 한 사람의 데이터는 직선으로 이어집니다.

You must specify the number of numeric variables
and the location of the nominal variable.
숫자 변수의 갯수와 명목변수의 위치를 지정해 주어야 합니다.

It is recommended to adjust the 'alpha of Lines' to make it more transparent.
Enter the axis name appropriately.
'alpha of Lines'를 조절해서 좀더 투명하게 하는 것이 좋습니다.
축 이름을 적절히 넣어 줍니다.

Sometimes, depending on the unit, if numbers are gathered in a very small range, you can spread them apart so that they can be distinguished, try using various scales.
간혹 단위에 따라서 매우 적은 범위에 숫자가 모여 있다면 구별하기 좋도록 벌려줄 수 있는데 이 때 다양한 scale을 활용해 보세요.
It becomes much clearer to distinguish between group characteristics.
집단별 특징을 구분하기가 훨씬 명확해 집니다.

You can make small changes using different colors and themes.
다양한 색과 테마를 이용해서 약간씩 변화를 줄 수 있습니다.

'plot download'를 통해서 plot size를 조절하세요.
< PDF >, < SVG > < pptx >를 클릭하면 각각의 형식으로 다운로드 받을 수 있습니다.
Adjust the plot size through 'plot download'.
You can download each format by clicking < PDF >, < SVG > < pptx >.
당신의 데이터를 업로드 하려면 'want to use'를 활성화한 다음, 'Browse'를 클릭하세요.
오직 csv 파일만이 사용가능합니다.
Activate 'want to use' to upload your data, then click 'Browse'.
Only csv file is available.
댓글 없음:
댓글 쓰기