[그래프 그리는 사이트] dot plot, jitter plot, box plot, violin plot, spaghetti plot

site : https://tinyurl.com/dot-violin-box-plot
https://tinyurl.com/dot-violin-box
https://tinyurl.com/dot-violin-box2
https://tinyurl.com/t-test-and-plot
How to Use :

The example data has 6 columns.
Columns 1 to 4 are numbers (continuous variables).
Column 5 is the group variable (nominal variable).
Column 6 is 'id'(which is for spaghetti plot only)
예제 데이터는 5열로 되어 있습니다.
1열부터 4열까지는 숫자(연속변수)입니다.
5열은 집단변수(명목변수)입니다.
6열은 id이며, spaghetti plot을 만들 때만 필요합니다.

For values, specify 1 column.
Specify 5 columns for 'groups'.
X에는 1열을 지정합니다.
'groups'에는 5열을 지정합니다.

You will see the jitter plot and box plot in the second tab (plot).
당신은 두번째 탭(plot)에서 jitter plot과 box plot을 보게 됩니다.
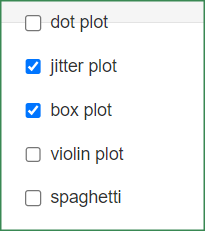
기본적으로(디폴트로) jitter plot와 box plot가 선택되어 있기 때문입니다.
This is because by default, jitter plot and box plot are selected.
dot plot와 violin plot를 선택한다면, 위의 것을 얻게 됩니다.
If you choose dot plot and violin plot, you get the above.

box plot와 violin plot와 spaghetti를 선택한다면, 위의 것을 얻게 됩니다.
이 때, id 열을 활용하여 점들을 연결합니다.
If you choose box plot, violin plot, spaghetti, you get the above.
In this case, connect the dots using the id column.

만들어진 plot을 꾸밀 수 있는 많은 옵션들이 있습니다.
여러분 스스로 직접 해 보면서 익히는 것을 권장합니다.
There are many options to decorate the created plot.
We recommend that you learn by doing it yourself.

'plot download'를 통해서 plot size를 조절하세요.
< PDF >, < SVG > < pptx >를 클릭하면 각각의 형식으로 다운로드 받을 수 있습니다.
Adjust the plot size through 'plot download'.
You can download each format by clicking < PDF >, < SVG > < pptx >.

당신의 데이터를 업로드 하려면 'want to use'를 활성화한 다음, 'Browse'를 클릭하세요.
오직 csv 파일만이 사용가능합니다.
Activate 'want to use' to upload your data, then click 'Browse'.
Only csv file is available.
댓글 없음:
댓글 쓰기