

7-1. Ternary Diagrams(I)

7-2. Ternary Diagrams(II)

7-3. Soil Diagrams

>> Fagan nomogram
7-4. Pedigree Chart

7-5. Random Forest

7-6. Nation Flag Table

7-7. Nation scatter plot

7-8. Nation Bar/Scatter plot

7-9. Dynamic Treemap

7-10. TreeMap(II)

7-11. Waffle Plot(II)

7-12. Sunburst Plot(II)

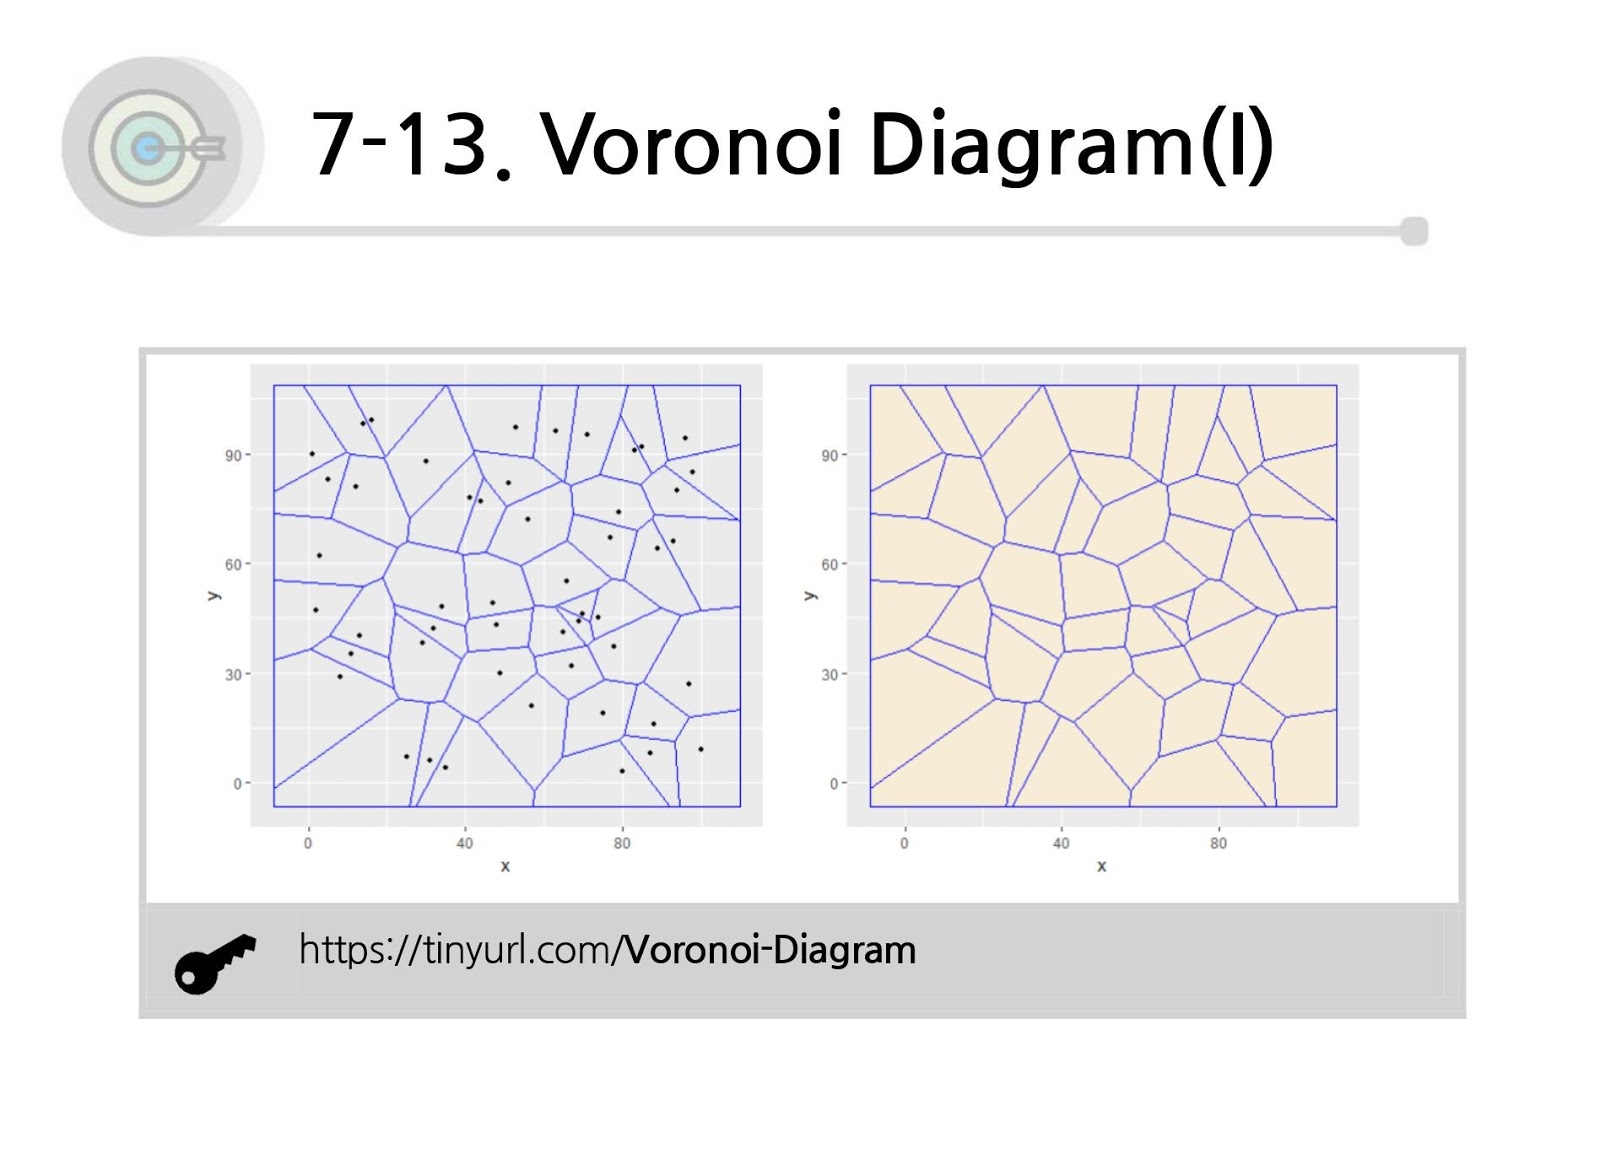
7-13. Voronoi Diagram(I)
7-14. Voronoi Diagram(II)

7-15. Voronoi and Delaunay

7-16. Lorenz Curve

>> Measuring Inequality, Concentration, and Poverty
7-17. Combination Plot

7-18. 3D Densitogram

7-19. Gradation Color Plot

7-20. Cause Effect Diagram

7-21. Named Colors


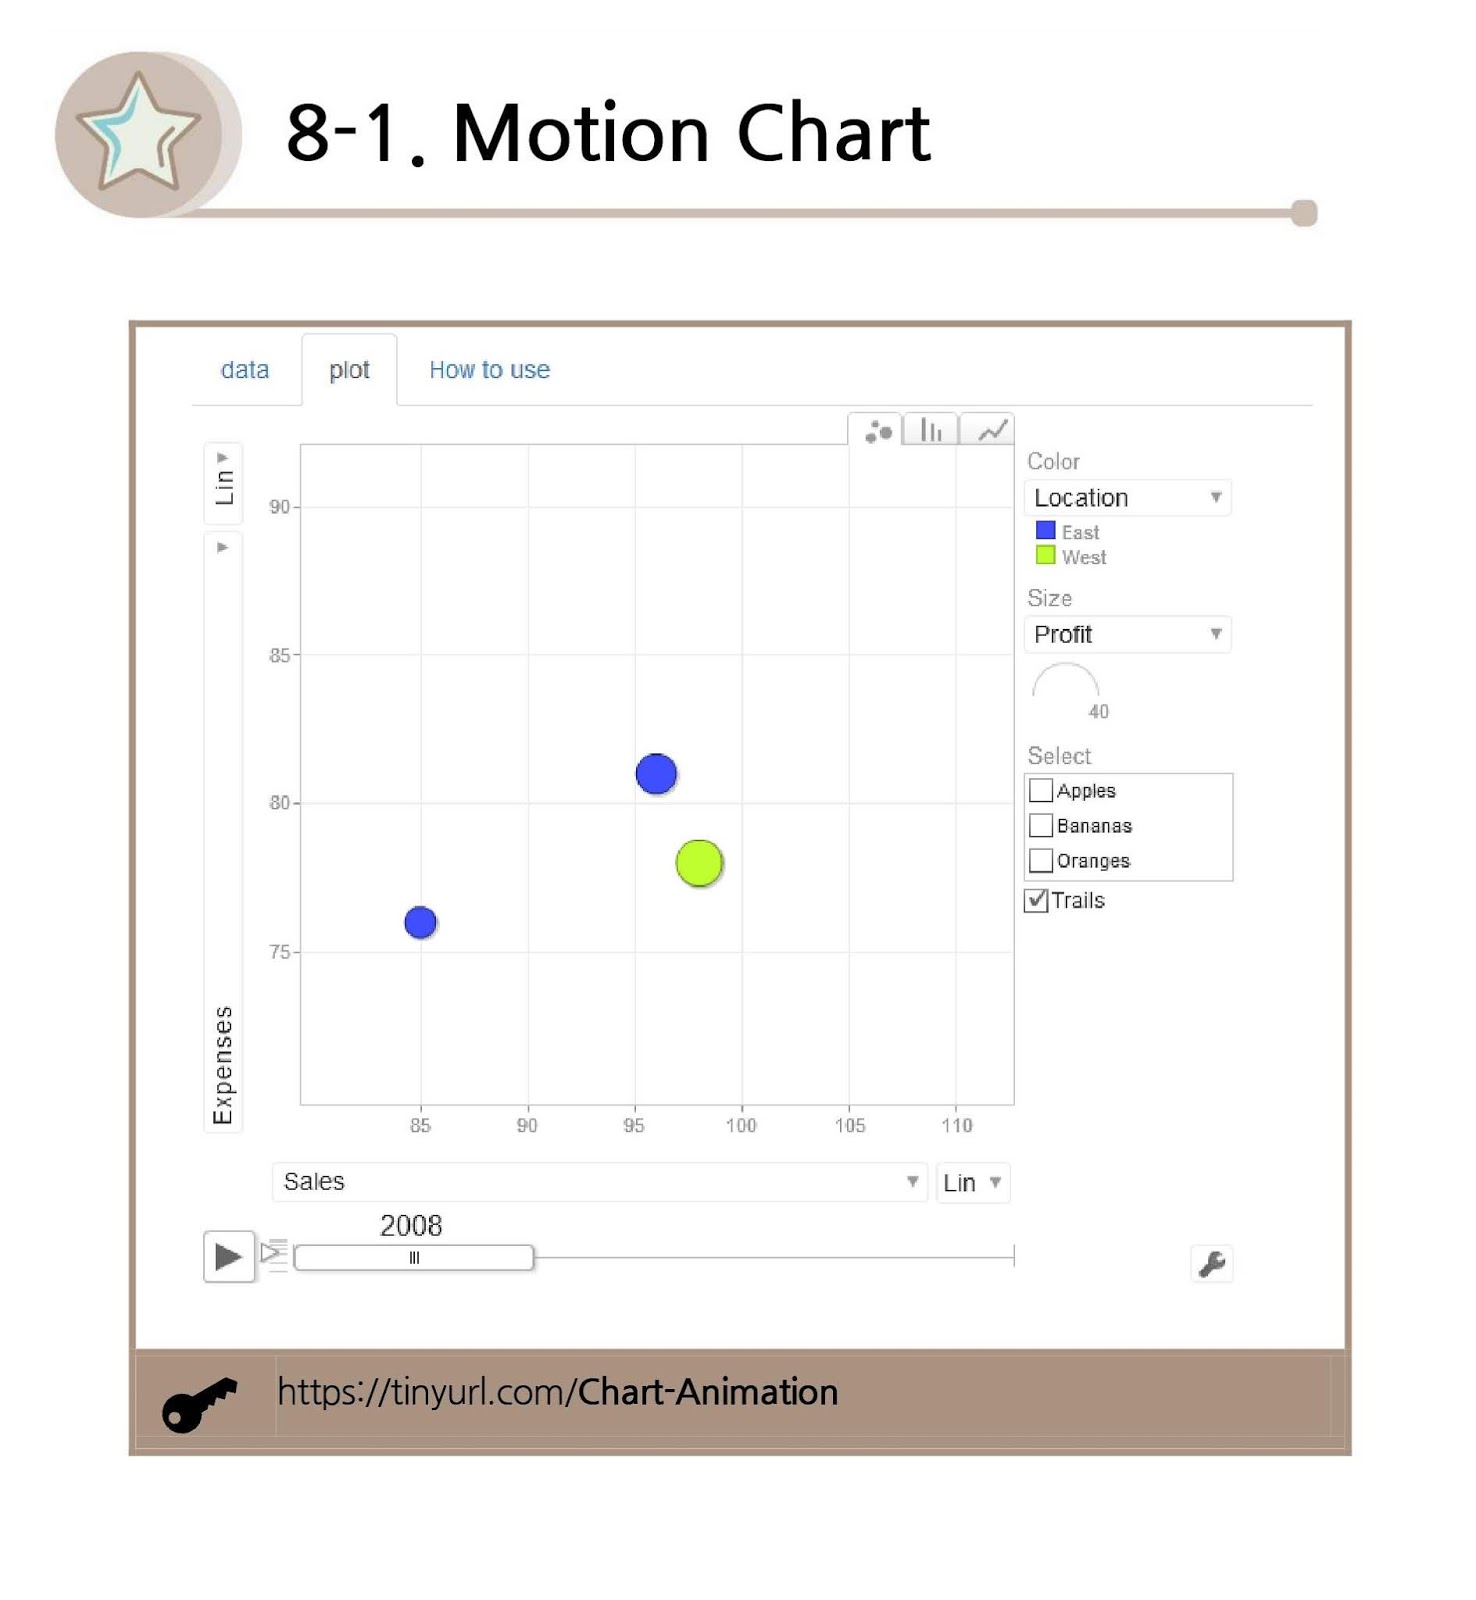
8-1. Motion Chart
8-2. Timeline(III)

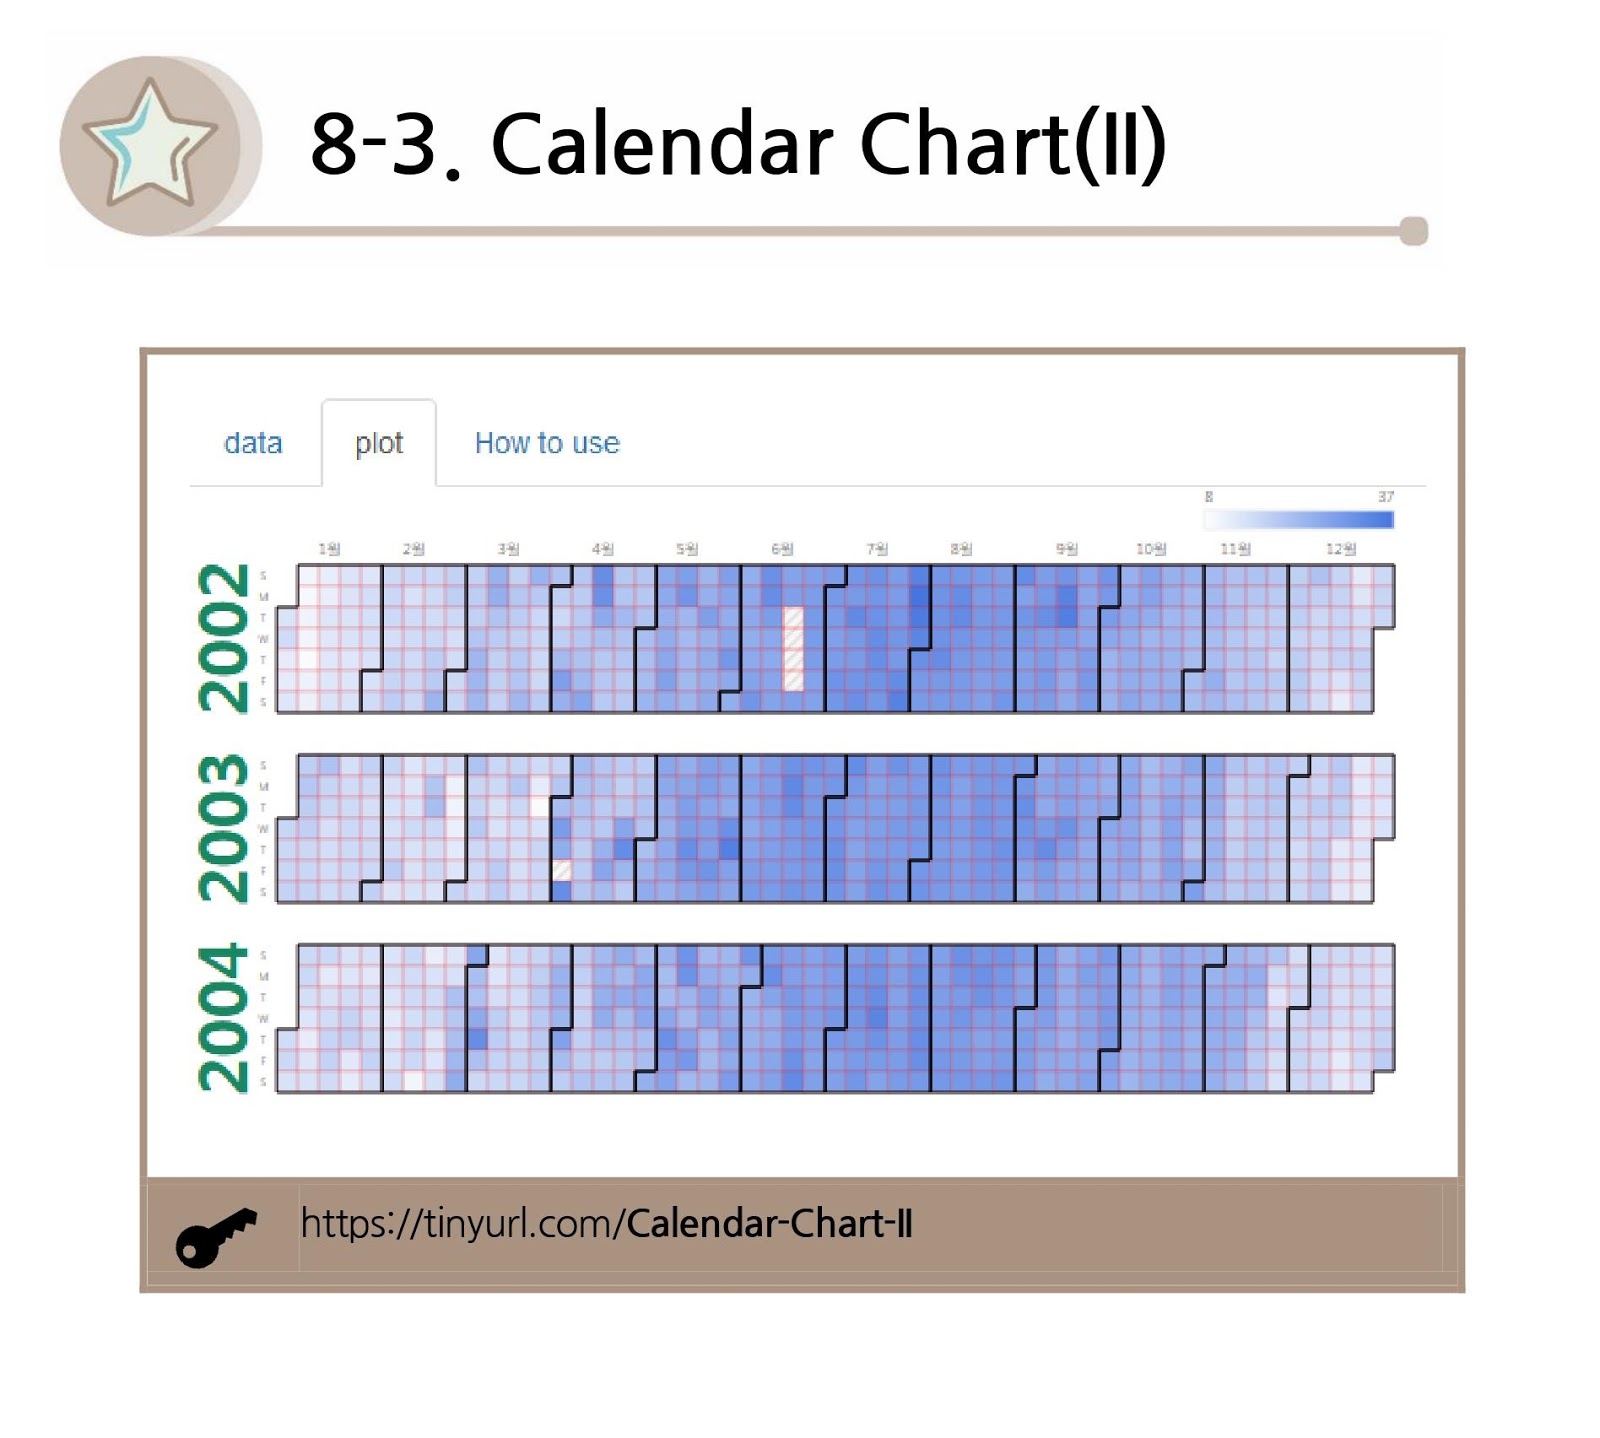
8-3. Calendar Chart(II)
8-4. Org Chart

8-5. Sankey Chart

8-6. Step Chart(II)

8-7. Carpet Plot

https://tinyurl.com/R-plot-I
답글삭제https://tinyurl.com/R-plot-II-2
https://tinyurl.com/R-plot-II-3-4
https://tinyurl.com/R-plot-II-5-6
https://tinyurl.com/R-plot-II-7-8