2019년 12월 27일 금요일

[Daddy's R Data Visualization] : USA Map

[Daddy's R Data Visualization] : USA Map


step 1: visit

https://play70.shinyapps.io/US_Map/
or
https://tinyurl.com/US-ezMap

step 2 : see the example data


'state' and others(with numbers)
'state' has the name of USA states

step 3: get the plot and edit


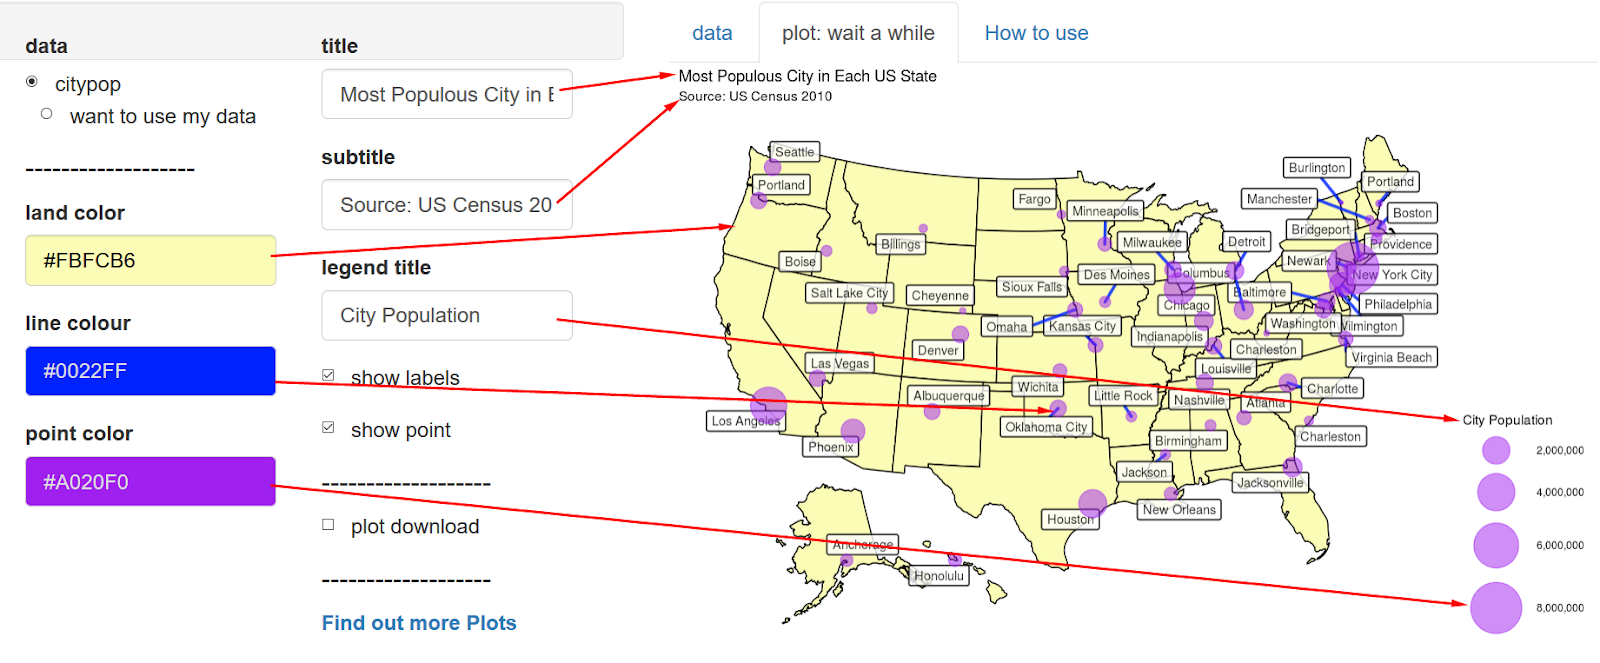
set the colors for high value and low value,
the colors for the territories and labels.

you can select the data column to show.
if you deactivate the "show labels', you can get the cleaner one.

step 4 : another data


this data have 'fips' and others.

step 5 : get the plot and edit more


you can see the plot.
you can download the plot as a PDF or a PPTX.

You can edit more with the PPTX

step 6 : your data

edit your data in EXCEL and save as "CSV".
your data should have at least one of 'state' and 'state'.


[Daddy's R Data Visualization] : USA Bubble Map

[Daddy's R Data Visualization] : USA Bubble Map

example 


step1: visit here

https://play71.shinyapps.io/US_Bubble_Map/ 
or
https://tinyurl.com/US-Bubble-Map
actually, they are the same

step2: see the data structure


example data has 4 columns (label, size, lon, lat) and your data should have the same.

step3: get the plot and edit


you can select 3 colors and 3 texts, as you want


You can download the plot as a PDF or a PPTX file.
While resizing it, if you upsize you can get smaller texts.


Using pptx. you can edit more precisely as you want.

step 4: upload your data


Prepare your data like example data in EXCEL.
Save as an CSV file.
Click "want to use my data" and upload.


2019년 10월 23일 수요일

Q method : How to arrange the CARDS


Q method, How to arrange the CARDS

step 1: delete 1 in the yellow cells or write 1 around yellow cells, as far as it looks like a mountain
step 2: make it sure the total number as you want and plan
step 3: check the weight in the green cells

2019년 8월 9일 금요일

Father’s [Data Visualization] 2nd book part 7/part 8


   7-1. Ternary Diagrams(I)


  7-2. Ternary Diagrams(II)


  7-3. Soil Diagrams

>>  Fagan nomogram


 7-4. Pedigree Chart


  7-5. Random Forest


  7-6. Nation Flag Table


  7-7. Nation scatter plot


  7-8. Nation Bar/Scatter plot


  7-9. Dynamic Treemap


  7-10. TreeMap(II)


  7-11. Waffle Plot(II)


  7-12. Sunburst Plot(II)


  7-13. Voronoi Diagram(I)


  7-14. Voronoi Diagram(II)


  7-15. Voronoi and Delaunay


  7-16. Lorenz Curve


>> Measuring Inequality, Concentration, and Poverty


    7-17. Combination Plot


  7-18. 3D Densitogram


  7-19. Gradation Color Plot


  7-20. Cause Effect Diagram


  7-21. Named Colors


  8-1. Motion Chart


  8-2. Timeline(III)


  8-3. Calendar Chart(II)


 8-4. Org Chart


  8-5. Sankey Chart


 8-6. Step Chart(II)


  8-7. Carpet Plot

>> QR code generator   


Father’s [Data Visualization] 2nd book part 5/part 6


   5-1. Slope Chart(I) http://tinyurl.com/Slope-Chart
 

   5-2. Slope Chart(II) http://tinyurl.com/Slope-Chart-II


>>Repeated Measures Correlation *

>> Google Trends   https://tinyurl.com/Goo-Trend  


    5-3. Timeline(II) https://tinyurl.com/timeline-II


  5-4. Pollen Diagram


    5-5. Feather plot


    5-6. Spaghetti plot(II)


    5-7. Epidemic Curve


   5-8. Smoke Plot


>> Many Comparative Line Plot

 5-9. Horizon Plot(II)


  5-10. Time related Plots


>> 6 sigma chart

>> Quality improvement charts

 5-11. Forecast


  5-12. Intervention-Analysis*


  5-13. Changepoint Line Chart*


  5-14. Change-Points  Estimation*


  5-15. Autocorrelation*


   5-16. Imputed Time-Series


   5-17. Dissemination Ratio


  5-18. Lexis Diagram


   6-1. Plot with Significance


  6-2. Multifactor ANOVA Plot*


  6-3. Variance Plot*


  6-4. ANCOVA plot*


  6-5. Residual Plots for linear M


  6-6. Generalized LM*


  6-7. Calibration Plot


  6-8. Classifier plot


  6-9. Prediction from LR


  6-10. ROC from LR


  6-11. Dose-response curve


  6-12. Coefficients Plot*


  6-13. 2D HE Plot*


  6-14. OR and HR plot(II)


 6-15. Cox/Logistic Nomogram


 6-16. HD Cox Nomogram


  6-17. Tukey Ladder of Powers


 6-18. Agreement Plot


  6-19. Adverse Events plot