download files(with folder)
https://drive.google.com/file/d/1lFwiuUFlKfdS0_UKRmUUOe-yN-fOd8WD/view?usp=sharing
https://tinyurl.com/densitogram-histogram
= https://tinyurl.com/densitogram-histogram2
>> https://tinyurl.com/densitogram-histogram3
https://tinyurl.com/Treemap3
https://tinyurl.com/Treemap4
https://tinyurl.com/Many-Years-Plot
https://tinyurl.com/Seasonal-Plot
https://tinyurl.com/Densitogram-Series
https://tinyurl.com/Horizon-Plot
= https://tinyurl.com/Horizon-Plot2
>> https://tinyurl.com/Horizon-plot-II
Calibration Plot
https://tinyurl.com/calibration-plot
https://tinyurl.com/Poisson-and-OR-plot
https://tinyurl.com/compare-KM-curves
= https://tinyurl.com/compare-KM
= https://tinyurl.com/compare-KM2
> https://tinyurl.com/KMnTable
= https://tinyurl.com/KMnNoRisk
https://tinyurl.com/Packed-Circles-Plot
https://tinyurl.com/Complex-Relationship-plot
https://tinyurl.com/Circular-Flow-Plot
https://tinyurl.com/K-means-and-plot
https://tinyurl.com/Partitioning-Around-Medoids
https://tinyurl.com/Dendrograms2
https://tinyurl.com/Cluster-CLARA
https://tinyurl.com/Clustergram
https://tinyurl.com/Decision-Tree-rpart
https://tinyurl.com/Decision-Tree-party
https://tinyurl.com/Decision-Tree-tree
https://tinyurl.com/Manhattan-Chart
= https://tinyurl.com/Manhattan-Chart2
https://tinyurl.com/Quality-improvement
https://tinyurl.com/map-and-chart
https://tinyurl.com/Rose-Star-Plots
https://tinyurl.com/Map-and-Nightingale
https://tinyurl.com/Map-with-dot-and-line
위의 지도가 구글 정책 변경으로 잘 구현되지 않아
아래의 다른 지도를 만들었습니다.
https://play31.shinyapps.io/Map-with-dot-and-line/
https://play31.shinyapps.io/Map_Pie2/
파워포인트로 다운로드 될 수 있습니다.
자세한 설명은 2권에서 설명하겠습니다.
https://tinyurl.com/Scatterplot-with-Smoother
https://tinyurl.com/Scatter-of-plots
https://tinyurl.com/Clock-plot-multi
https://tinyurl.com/word2cloud
https://www.jasondavies.com/wordcloud
>> https://tinyurl.com/word4cloud2
https://tinyurl.com/VennDiagram2
https://tinyurl.com/timeline-easy


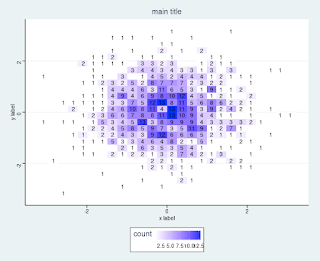






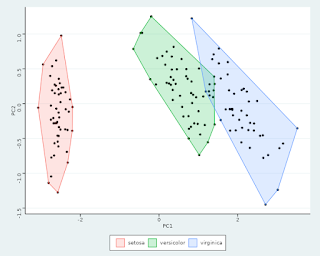


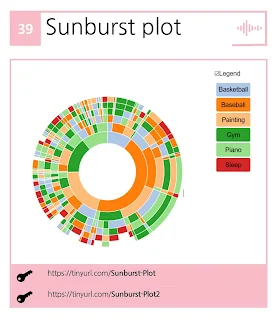


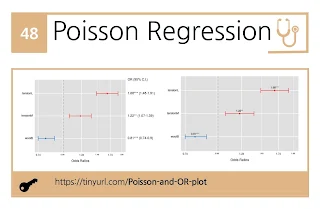


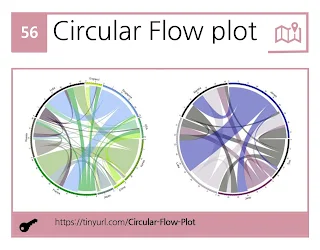


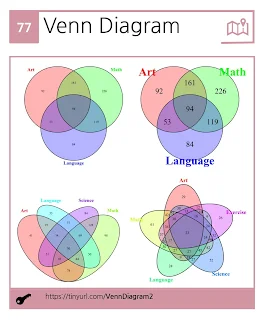


shortened URL = https://tinyurl.com/data2visualize
답글삭제교수님 책은 거의 다 사서 보고 있습니다. 매우 유익한 정보 감사합니다. 혹시 jitter로 표현할때 x-axis의 group별로 표현시 단순 동그라미만 있는 게 아니라, 세모, 네모 그리고 비여있는 세모, 네모 , 동그라미 등 각 군별로 모양을 다양하게 할 수있으면 좋을 것 같습니다.
답글삭제네 옵션을 다양하게 하면 그만큼 복잡해 져서 가능한 단순하게 하려고 했지만, 알씀하신 것을 고려해 보겠습니다.
삭제수정하였습니다.
삭제작성자가 댓글을 삭제했습니다.
답글삭제As we know there are many companies which are converting into Big Data Solutions Developer with the right direction we can definitely predict the future.
답글삭제I don't think so,
삭제if your background is mathmatics or statistics you can understand big data is just a little better than a small data.
Dear Dr,
답글삭제You are a life saver. May God bless you for such a beautiful blog. Thank you so much. Can we enlarge the size of the axes manually or size of the fonts?
after download the plot as pptx, and control+shift+G.
삭제and you can modify it in powerpoint as routine
Dear Dr,
답글삭제You are a life saver. May God bless you for such a beautiful blog. Thank you so much. Can we enlarge the size of the axes manually or size of the fonts?
I am Jeehyoung Kim. MD.
삭제I am preparing for one short course for
"R data visualization for those who do not know R(1)"
or "The easiest R Data Visualization(1)"
This course uses Zoom.
The duration of this lecture will be 30 minutes in English.
The scheduled time is
Seoul: Saturday, April 10, 10:00 am for 30 minutes
(I don't know your local time
for example in California : Friday, April 9, 6:00 pm)
If you miss the front part, you may not understand the whole coherently.
It will be beneficial if you are on time for this course.
please enter here just 3minites before
https://zoom.us/j/93696692420?pwd=V01tMEhRSEJvU0NzVWxqY1ZHNFNPZz09
You can invite your students also as far as Zoom can support.
Best regards,
JH Kim
안녕하세요, 선생님
답글삭제메타분석, 비율(한집단)에서 제가 37의 study를 입력했더니 forest plot이 중간에 잘려서 보이지 않습니다. 다운로드해서 봐도 그렇고요. result는 다 분석해서 잘 보입니다. 혹시 갯수에 제한이 있는지 문의들립니다.
안녕하십니까 교수님, 유튜브를 통해 교수님의 강의를 듣고 bland-altman을 활용한 논문을 작성하게 되어 교수님이 올려주신 프로그램을 잘 사용하고 있습니다. 저의 질문은 두개의 방법을 비교하기 위해 X축의 값을 동일선상으로 설정하고 싶으나, X축이 원하는대로 설정되지 않아 혹시 X축의 값을 바꿀 수 있는지 궁금합니다.( X축 척도 변경)
답글삭제cox 회귀분석 표 만드려고 하는데 StartTag: invalid element name [68] 오류가 뜨는것은 무엇때문일까요?
답글삭제혹시 어떤 주소의 것이지요? cox 분석도 여러 곳에서 하고 있어서..
삭제Could you please tell me how can i select my variables? I can select and put variables
답글삭제I am Jeehyoung Kim. MD.
삭제I am preparing for one short course for
"R data visualization for those who do not know R(1)"
or "The easiest R Data Visualization(1)"
This course uses Zoom.
The duration of this lecture will be 30 minutes in English.
The scheduled time is
Seoul: Saturday, April 10, 10:00 am for 30 minutes
(I don't know your local time
for example in California : Friday, April 9, 6:00 pm)
If you miss the front part, you may not understand the whole coherently.
It will be beneficial if you are on time for this course.
please enter here just 3minites before
https://zoom.us/j/93696692420?pwd=V01tMEhRSEJvU0NzVWxqY1ZHNFNPZz09
You can invite your students also as far as Zoom can support.
Best regards,
JH Kim
https://jee-hyoung-kim-27.shinyapps.io/Line-with_xspline/
답글삭제How can i fix month seqence (1, 2, 3....) in X axis?
Name month as M01, M02, M03.......
삭제this is the easeist way
작성자가 댓글을 삭제했습니다.
답글삭제작성자가 댓글을 삭제했습니다.
삭제2 by 2 table로 sensitivity CI 구하는 page에서는 data 로딩하는 메뉴가 안보이는데 어떻게 해야하는건지요 ㅠ
답글삭제데이터를 직접 입력하는 것입니다. 4개의 숫자 칸에..간단해서 파일을 업로드 하지 않고 직접 입력하도록 만들었습니다.
삭제I am really very happy to visit your blog. Directly I am found which I truly need. please visit our website for more information
답글삭제Data Visualization Service in USA
https://tinyurl.com/Aggregate-Plot
답글삭제or
https://play137.shinyapps.io/Aggregate_Plot/
KM curve에서 cumulative incidence를 percentage로 표현되는 방법은 없을지요?
답글삭제늘 노고에 감사드립니다.
교수님 귀한 자료 쓸수 있게 해주셔서 감사합니다
답글삭제OR and HR plot(II) 에서 csv파일 입력된 순서대로 그래프를 그리고 싶은데 자꾸 자동으로 다르게 정렬이 되네요 condition, group, name변수까지 plot에서 위치를 자유자재로 이동시키는 방법이 있을까요?
대부분의 경우에 오즈비가 큰 것부터 작은 것 차례로 두는 것을 원해서 그렇게 된 것이고요.
삭제만든 다음에 수작업으로 수정하거나, 이미 오즙와 신뢰구간을 구한 다음에 다른 도구를 사용할 수 있습니다.
작성자가 댓글을 삭제했습니다.
답글삭제