simple chi-square test
2019년 8월 10일 토요일
2019년 8월 9일 금요일
Father’s [Data Visualization] 2nd book part 7/part 8


7-1. Ternary Diagrams(I)

7-2. Ternary Diagrams(II)

7-3. Soil Diagrams

>> Fagan nomogram
7-4. Pedigree Chart

7-5. Random Forest

7-6. Nation Flag Table

7-7. Nation scatter plot

7-8. Nation Bar/Scatter plot

7-9. Dynamic Treemap

7-10. TreeMap(II)

7-11. Waffle Plot(II)

7-12. Sunburst Plot(II)

7-13. Voronoi Diagram(I)
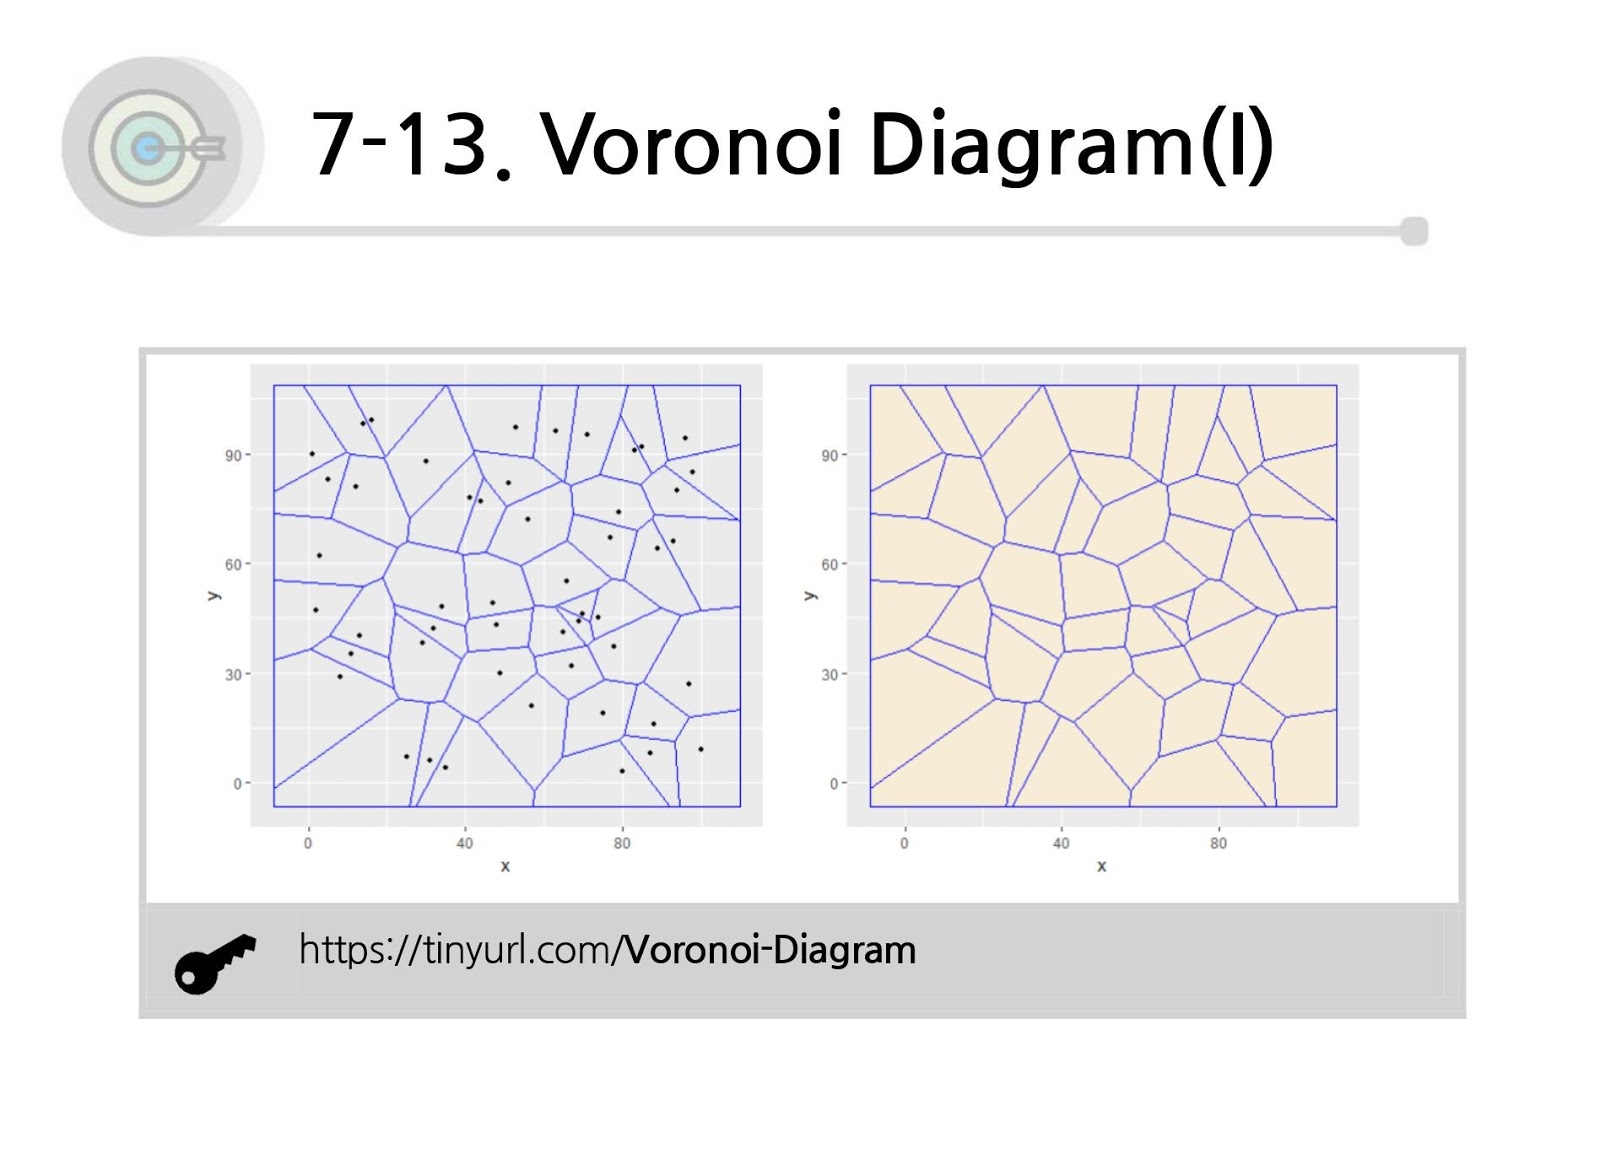
7-14. Voronoi Diagram(II)

7-15. Voronoi and Delaunay

7-16. Lorenz Curve

>> Measuring Inequality, Concentration, and Poverty
7-17. Combination Plot

7-18. 3D Densitogram

7-19. Gradation Color Plot

7-20. Cause Effect Diagram

7-21. Named Colors


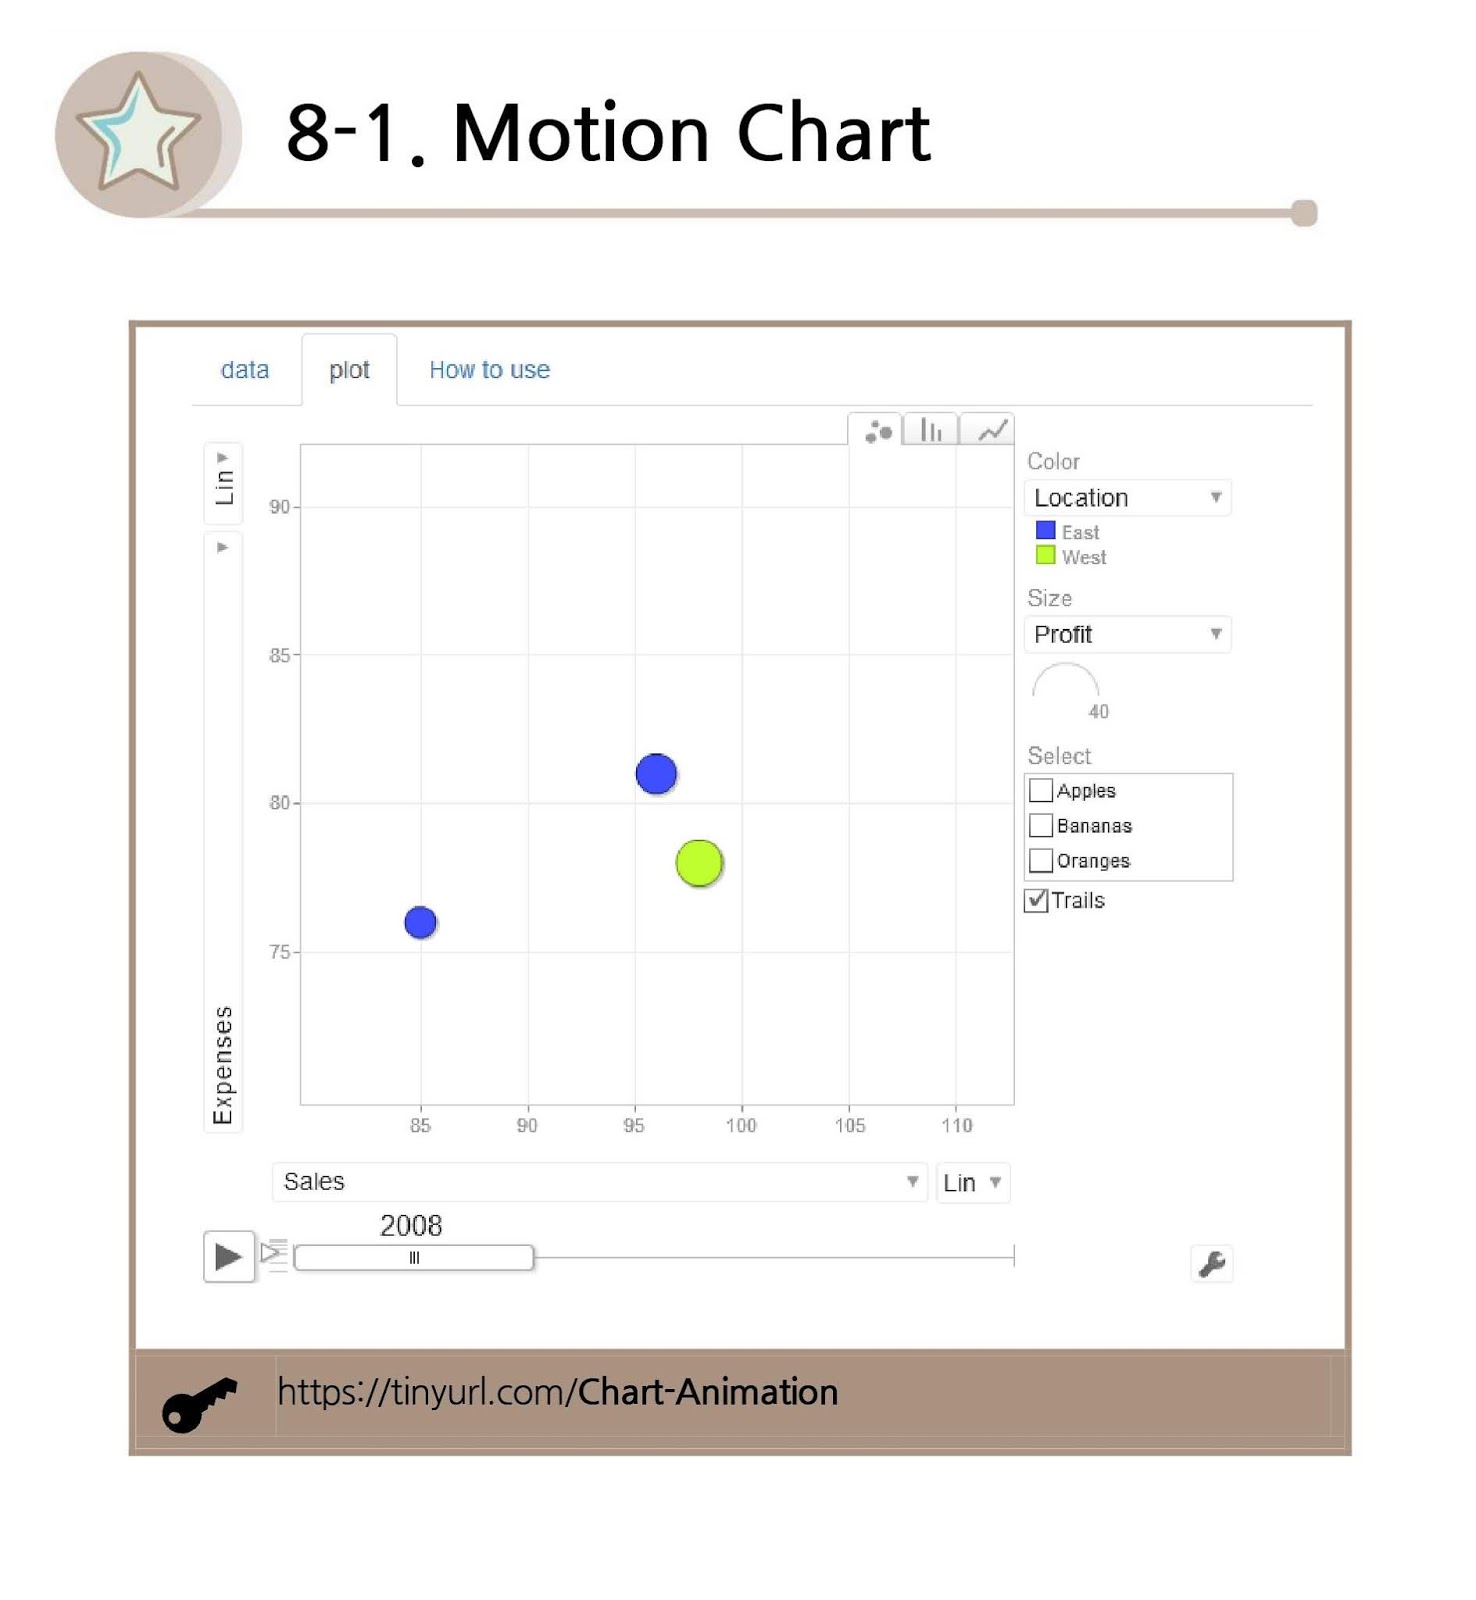
8-1. Motion Chart
8-2. Timeline(III)

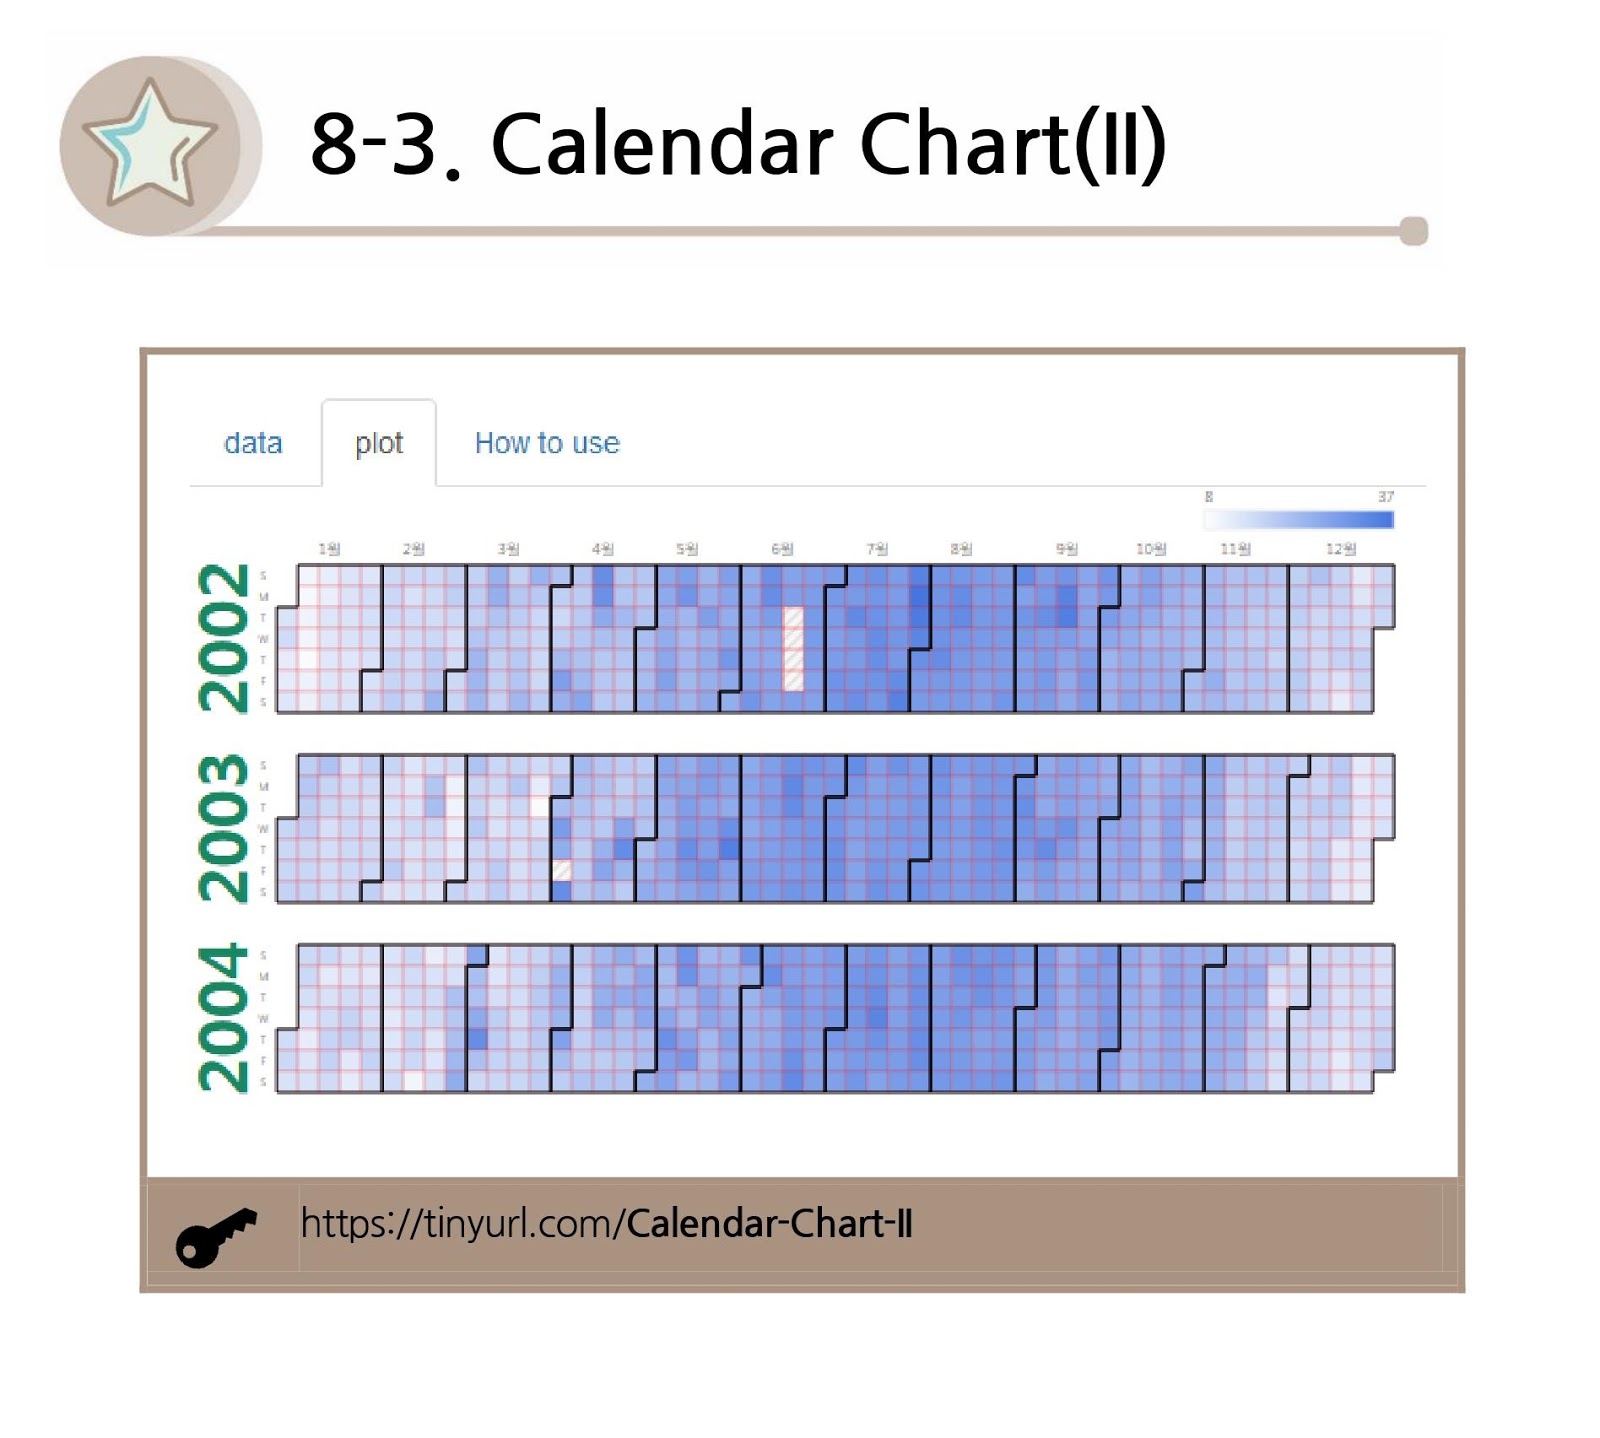
8-3. Calendar Chart(II)
8-4. Org Chart

8-5. Sankey Chart

8-6. Step Chart(II)

8-7. Carpet Plot

Father’s [Data Visualization] 2nd book part 5/part 6

5-1. Slope Chart(I) http://tinyurl.com/Slope-Chart

5-2. Slope Chart(II) http://tinyurl.com/Slope-Chart-II

>>Repeated Measures Correlation *
>> Google Trends https://tinyurl.com/Goo-Trend
5-3. Timeline(II) https://tinyurl.com/timeline-II

5-4. Pollen Diagram

5-5. Feather plot

5-6. Spaghetti plot(II)

5-7. Epidemic Curve

5-8. Smoke Plot

>> Many Comparative Line Plot
5-9. Horizon Plot(II)

5-10. Time related Plots

>> 6 sigma chart
>> Quality improvement charts
5-11. Forecast

5-12. Intervention-Analysis*

5-13. Changepoint Line Chart*

5-14. Change-Points Estimation*

5-15. Autocorrelation*

5-16. Imputed Time-Series

5-17. Dissemination Ratio

5-18. Lexis Diagram


6-1. Plot with Significance

6-2. Multifactor ANOVA Plot*

6-3. Variance Plot*

6-4. ANCOVA plot*

6-5. Residual Plots for linear M

6-6. Generalized LM*

6-7. Calibration Plot

6-8. Classifier plot

6-9. Prediction from LR

6-10. ROC from LR

6-11. Dose-response curve

6-12. Coefficients Plot*

6-13. 2D HE Plot*

6-14. OR and HR plot(II)

6-15. Cox/Logistic Nomogram

6-16. HD Cox Nomogram

6-17. Tukey Ladder of Powers

6-18. Agreement Plot

6-19. Adverse Events plot

피드 구독하기:
글 (Atom)